Analytics

Analytics

data_ai
Written By: Gokul S

Blog

Data Analytics- the catalyst fueling Smart Maintenance

April 5, 2021 7-Minute read

The digitally born businesses have been successful in rapid disruption and value creation, through platforms. This is because the platform-based business models enhance the ecosystem, facilitate value exchanges between different stakeholders in the ecosystem while supporting massive amounts of data. In short, platforms enable data-driven decision-making.
In the earlier article, the importance of data for asset management is elaborated in detail. In this article, the focus is on the scope of smart management and its application in the Asset Intensive Industry.

Smart Assets & Equipment: Unlocking present-day business puzzles


Today, the majority of business firms are relying more on technology, smart assets, and equipment which are a must to provide the best service to their customers.   
Presently growing businesses are taking care of assets to increase their business performance, to optimize total cost and sustainability that focuses on energy efficiency. Businesses are driven by the future changing technology and equipment, to come out successful in the market.
 
However, sustainability can be achieved through smart assets and their maintenance, to meet the demands of the Industry. IT service providers are therefore trying to solve the modern business puzzle. Smart tools for monitoring energy consumption in production sites to streamline the replacement of defective equipment and process control decisions and even behavioural change. The result is to eliminate performance, downtime, traditional asset management functions, or outdated equipment and improve regulatory compliance from lower carbon emissions.


Reasons to start embracing smart assets


Realigning asset groups: To facilitate performance analysis, asset groups should incorporate assets with similar characteristics such as life cycles and maintenance activities. So, for example, electromechanical assets, such as the capacitor bank, should be separated from electronic assets, such as the capacitor bank’s electronic controller, as they have different asset lives. Source
Realigning depreciation rates: Realigning depreciation rates will enable organizations to adequately account for variable life spans in the realigned asset groups.
Creating a centralized Asset health center: Defining the physical, operational, and maintenance history data is necessary to create an overall view of each asset’s health, condition, and performance. Utilities that take an integrated asset health approach will have a foundation for plugging multiple new smart grid assets into the organization more easily.


Holistic asset data strategy: The Holistic data strategy drives multiple data sources across new as well as legacy systems. Also, the right analytical and business intelligence tools to facilitate asset cost, risk, and performance analysis must be adopted.
Developing a proactive asset strategy process: The strategy for new electronic asset groups should include proactive maintenance, upgrading, and replacement.


Pre-emptive Analytics: Driving force in smart maintenance


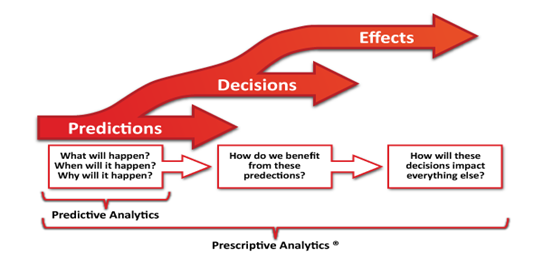
Pre-emptive analytics better known as Prescriptive analytics examines data structure and provides the best possible ways of solutions to make a specific outcome happen across different scenarios. 
Predictive analytics keeps decision-makers informed about multiple decision choices with their anticipated impact on specific key performance indicators, whereas prescriptive analytics can provide an insightful path to a certain particular outcome. 


Predictive analytics – Foundation for an Analytical approach


The Business intelligence tools have built-in prescriptive analytics to provide organizations with actionable insights that empower them to make effective decisions. One interesting application of prescriptive analytics is in the Energy and Utility business management, where prices are constantly fluctuating based on ever-changing political, environmental, and demand conditions.
Asset efficiency and its effective management are the most common challenges faced by Utility firms. Predictive analytic techniques can effectively forecast the asset efficiencies for future periods with the help of advanced forecasting techniques. The asset efficiencies can be accurately predicted based on the smart metering data that is coming in which are already covered in the fields. 
The efficiency of the operational network and assets get reversely impacted.  Predictive analytics can devise statistical models that can consider these errors in base data inputs to some extent. 
Some of the key benefits of Smart asset and predictive analytics are:

  1. Smart device measurements are often analyzed in real-time to reduce the utilization gaps for critical assets
  2. Causes of asset failures are analyzed in real-time and failure is predicted before they occur
  3. Better adherence to the key reliability indices due to fewer customer interruptions and lower asset downtimes
  4. Improved asset availability due to the actions taken in real-time. e.g.  Real-time flow adjustments in the network to control the overload in a transformer to improve its availability
  5. Variance in asset risks is predicted in advance through forecasting techniques that help in better asset investment planning
  6. Real-time data analytics helps in improving asset efficiencies 


Prescriptive Analytics - Effective Analytics practice:


Prescriptive analytics is a type of data analytics, the technology which supports businesses to take better decisions through the analysis of raw data. Particularly, prescriptive analytics focus on factors of information about possible scenarios or situations within the available resources, Pre-performance, current performance, and provide insight on the course of action to do. 
analytics


Image credit: Wikipedia
With New age business, prescriptive analytics can combine data from disparate systems to enable an analysis of input variables. Prescriptive analytics is the final step for operational efficiencies and business goals.

Conclusion:


Data and analytics have an advanced set of solutions for smart management of assets in the Energy and Utility sector. Data captured through smart devices, analytics adoption, and asset management strategy help the Utility industry more.

Soon smart asset management aims to empower the Utility business through pre-emptive analytics for more relevant inferences and Predictive analytics tools and techniques to predict various solutions of asset management using the real-time data retrieved from smart devices. With the help of Prescriptive analytics will help shift data into real, fact-based, and unbiased courses of action which empowers decision making real-time.
Sonata empowers enterprises to realize modern platforms with Reporting and Analytics, Real-Time data insights, and consulting powered by IoT, AI/ML solutions. 
Sign up for our upcoming webinar here to know more on live use cases and experiences of helping customers achieve data driven digital transformations. 
 

Data- The new oil powering the Asset Intensive business
Written By: Sarita Chitrapu

Blog

Data- The new oil powering the Asset Intensive Business

March 1, 2021 7-Minute read


Assets, fundamental for any business, from the lowest value cost office stationery pin to high-value machinery, or information technology infrastructure adds value to the business entity. Data analytics is the driving force that helps Asset Intensive companies derive value to stay ahead of the competition in the Utilities industry.
Physical assets are the blood and bone for the energy and utility industry. New layers of transition affect the industry, including Deregulation, Changing regulations, Modern ideology business entrants, usage habits, etc. Therefore, enterprise asset management becomes crucial for many energy and utility organizations towards profitability and long-term sustainability.
With focused data management and quality assessment processes in the energy and utility industry, information is collected from field asset and intelligence platforms. Defective/failure rates and root causes of assets can be rectified with predictive analytics a condition-based maintenance model, the risk-based model predicts time to failure, and calculates the subsequent result of operational experience.

The evolution of Data analytics in the Asset intensive Industry


Despite efforts by the Large Energy and Utility companies, the International Organization for Standardization, and other association of industry had not set any standard guidelines to manage assets in a procedural form. 

Typically, Organizations engage their engineers and field service engineers to determine asset health condition based on their traditional theoretical manual experience, that is scheduled based servicing of field assets.

For Energy and utility organizations, asset management has become a major concern as a matter of maintaining and replacing assets based on fixed schedules that might have been installed and running years earlier. It’s quite common for them to periodic maintenance, and that leads to more time- consuming and more costly for a business entity.
 In fact, managing assets in this way have evident drawbacks. Regular maintenance programs tend to vary across companies. The lack of standards for asset management and the variety of asset-management plans make it riskier for regulators to determine whether energy and utility companies are carrying what they should ensure that their asset management network will perform properly.


Effective asset management with Smarter Data


Data and Analytics are the epicenters that provide numerous solutions to the asset management Industry. The companies who try to succeed must prioritize and rethink the current investments in, Smart devices, Sensors, communications devices, and hardware that allow objects to track and controlled remotely those are more affordable and reliable

This transformational shift replaces the traditional models which were dependent for maintenance schedules in the asset management protocol. This resulted in time management, flexible handling, streamlining processes, and analytically trigger the uses with real-time performance data capturing and predictive models to drive asset-management decisions accurately.


Data Analytics- the key driver to ensuring productivity in the Energy/Utility Sector.


In order to take bold decisions about these ageing assets, the maintenance management of utility network should take certain precaution into account a multitude of data generated from different areas, such as:

  1. The aggregate historical data for asset management, scheduled maintenance, cost-effectiveness, and asset investment planning
  2. The real-time status of equipment and its usage statistics, warning alarms, thresholds, and degradation patterns.
  3. Predictions derived from reliability studies.
  4. Multidimensional analysis and query: To analyze and capture asset data from different viewpoints.
  5. It can help with Log data analysis: To monitor the asset health during its operational lifetime 


Evolving Asset Management – Analytics-Driven Decisions in Energy and Utility Industry


The utility business can benefit from restructuring its asset and redefining asset management strategies technology innovation, the term came up with a new shift in the business process. Data and analytics technology empowering energy & utilities to take asset management to an entirely new elevated level.
Many Organizations are already in the practice of advanced devices and remote working model to gain additional profitability.  Investing in smart devices helps to generate real-time data, develop new asset management strategies that can improve reliability, also customer satisfaction, efficiency, and long-term planning can be achieved.
Data and analytics not only provides insightful reports to the management but also helps to manage ageing assets. Utility companies are also exploring ways to reliably integrate large quantities. The Asset management strategy may change due to a change in regulatory compliance for utilities that has evolved and will continue to evolve.
Hence, capturing data has become the most required and vital solution to manage the above-stated pain points for organizations.
Digital Asset management and operational excellence require many things to make it successful and more profitable to organizations, out of that most important are:

  1. Smart device adoption
  2. Leveraging sensor and remote access environment 
  3. Digital asset management strategy
  4. Asset management best practice


Big data and analytics functionality having potentiality to manage enterprise asset data like, Volume,
velocity, variability, low veracity and variety are current data features methodology, a technique to help to understand the data models and proof of concept by applying it to the data model of a criticality analysis. 
With the help of data analytics platform and business intelligent App, we can present reporting insight about the criticality analysis process to interact with the end user and, based on reporting needs and end user requirements.
It’s not possible to manage what you can’t see; Data analytics can come to the rescue in such an instance. Data analytics can allow to utilize economics-based decision-making operation right form as well as better manage high-loaded and under-loaded asset performance. 
Customer satisfaction with unplanned outage detection and prediction in analytic based business approach. Therefore, most of the business with foresight vision like to deliver in such a way that Preparing for Tomorrow’s Distribution-Centric world, also moving ahead of competitor circle. 
Sonata empowers enterprises to realize modern platforms with Reporting and Analytics, Real Time data insights and consulting powered by IoT, AI/ML solutions. Visit our Data and Analytics offerings page to know more on how we can enable you on your path to true digital transformation. 

Data Analytics
Written By: Gokul S

Blog

Sonata’s unique Platformation™ approach helped realize a Global ISV’s urgent need to improve operational efficiency

January 11, 2021 7-Minute read


Global enterprises with a diverse product portfolio have one thing in common. They all acknowledge the pivotal role analytics play in their market success given the complexity of having a standardized framework which can factor in customizations of geography or a category. 


The pivotal role analytics play in market success:


In this case, The Client’s Business Operations team was facing challenges with visibility into their diverse business operations across the sales and marketing function. The CIO organization was tasked with chalking out a strategy to remedy the situation.  The team sought to do this had to be built on a bedrock of actionable insights with the right performance indicators and metrics at various geographic levels to help:

  • Define sales campaigns and other promotional initiatives 
  • Identify well-performing market segments and products 
  • Create an action plan for the sales force with achievable targets 
  • Provide decision-makers with insights for market penetration and to tackle strategic advances from the competition

Standardizing sales processes


Sales and marketing executives of the ISV needed data to automate standard sales processes and customize it based on geographies and regions. Apart from helping identify large business opportunities and at-risk customers, the process was developed to assist the organization in keeping up with changing business contexts, consumption patterns, and dynamic market trends. An insights platform to help leaders review progress, identify stumbling blocks, and coordinate better their teams for strategic sales interventions.
At the same time, there was a need for ad hoc operational insights delivered on a day-to-day basis –– with the intent to help marketing and sales teams track priorities, sell on-field, and make better data-driven decisions.
Here are some challenges the client had to overcome:

  • Lack of visibility into the sales team’s performance 
  • Forecasting upcoming quarter sales 
  • Lags in optimizing sales processes  


Sonata’s Platformation™ approach that met the client’s business goals

The platform was designed to meet the client’s business & marketing goals. The solution brought together key analytics, KPIs, revenue growth, and customer acquisition data to the forefront while managing the sales pipeline and forecasting market demand. This empowered sales executives, managers, and other leaders with real-time insights into key business drivers –– helping them make targeted, localized, and strategic decisions towards meeting their sales targets. 

The singular vision of Sonata in all this was to create a platform that could easily be adapted to various geographical and segmental needs, stressing on scalability, sustainability, robustness, and timeliness. Additionally, Sonata Software seamlessly connected 100+ data sources, 20+ dashboards, and hundreds of reports. Sonata Software also developed 1000+ KPIs to address the Client's data management and analytics needs.

Given Sonata Software’s continued engagement with the firm, the solution architecture and design thinking of the platform continues to evolve, incrementally. Today this will ensure that the latest market data, sales patterns, competitor analysis along with risks and opportunities are always at the fingertips of stakeholders. 

Additionally, the solution included  the following features:  

  • A centralized data library to seamlessly collate data from different sources 
  • A robust delivery channel to facilitate the self-service BI, empowering every persona to independently access data
  • An extensive repository of historical data to compare metrics for growth, business, health, and trending analysis 
  • A unified end-to-end BI solution, with built-in back-end analytics and reporting with the help of advanced technologies like: 
  1. SQL Server Stack 
  2. Tabular Model 
  3. Power BI 
  4. Azure 
  • Data integration capabilities from a variety of data sources from spreadsheets, application backends, ERP & CRM systems, other reporting & analytics and  various outputs of machine learning algorithms and forecasting systems
  • A customizable, future-proof framework using 5+ tabular data systems for data modelling 
  • A self-service BI system reflecting data sets across business situations for ad hoc insights 


Key Insights that enabled data-driven decision making

The Global ISV gained key insights into winning strategies, consumption patterns, competition, contextual resources, forecasts, and outlooks — all powered by a unified system and ad hoc analytics. The organization was thus able to:

  • Plan their sales strategies  better and work towards achieving their sales targets
  • Incentivize their sales force promptly, in line with the deals closed 
  • Reduce conflicts and confusions 
  • Minimize costs by automating sales processes 
  • Create personalized insights for specific tasks and personas
  • Automate data quality checks for improved accuracy and efficiency 
  • Facilitate quarterly and monthly business reviews across marketing and operations 
  • Track patterns and predict sales with the help of forward-looking intelligence  

Build a future-ready foundation to your digital transformation journey through Sonata’s Platform-based approach

Sonata’s platform-based Data approach enables manufacturers to yield faster ROI, lesser time-to-market for data-centric transformations aligned to their business priorities.  Sonata empowers enterprises to realize modern platforms with Reporting and Analytics, Real-Time data insights and consulting powered by IoT, AI/ML solutions. Visit our Data and Analytics offerings and services page to know more about how we can enable you on your path to true digital transformation. 

Industry 4.0: Transformation of the traditional manufacturing landscape with smart technologies
Written By: Marketing Team

Blog

Industry 4.0: Transformation of the traditional manufacturing landscape with smart technologies

October 22, 2020 7-Minute read

In the Industry 4.0 perspective, Smart manufacturing is a collaborative mechanism that is fully integrated to respond to the evolving demands and situations on a real-time basis in the manufacturing plant. With an increased reliance on newer technologies such as cloud computing, Big Data modelling, and the Internet of Things (IoT), the manufacturing sector has shown a major impact on:

  • Production being standardized
  • Demand being consistent and predictable 
  • Supply chains have become more stable

Data-driven manufacturing should be the approach manufacturing firms should adopt to stay ahead of the game. This will equip the decision-makers to predict the production pattern, Observe and fix potential maintenance issues that can arise and Identify any risks and take necessary actions so that they are able to drive future design and developments. 

Smart Manufacturing: Driving Manufacturing through Data Insights

Smart Manufacturing connects the machines through the Internet to gather data and check on the production process in a factory. Let us analyze a few reasons how smart manufacturing will drive the way ahead and benefit the entire manufacturing Industry:

  • With a vast amount of data generated in the production process, Smart Manufacturing helps suppliers ascertain what and when the manufacturers need the supply
  • Through optimum production cycles, the money saved can be utilized for product development. This helps production managers to identify where customers need products. This is an opportunity to deliver superior quality to the customers
  • With clear visibility, managers can forecast and fix production issues in time before it leads to issues resulting in production downtime or product quality issues
  •  Manufacturers are empowered to identify potential wastage when their enterprise solutions are in sync with the manufacturing operations

Manufacturing companies should tap the opportunity with valuable data that is readily available, that will enable them to pinpoint on specific issues as well as have resolutions for more efficient operation.

Optimize productivity in Manufacturing through Data Analytics

This application of technology through judicious use of data is proving to be beneficial beyond the conventional production of goods into business-critical functions like capacity planning, supply chain logistics, and product development. This process combines production, information sharing, and communication channels in the manufacturing ecosystem. 

Industry 4.0: Transformation of the traditional manufacturing landscape with smart technologies 
Image source: Ulala Lab

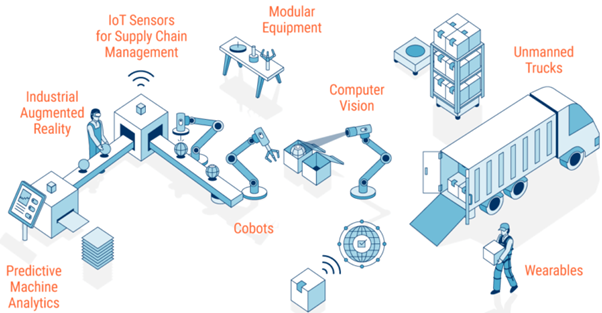
The data generated through robotics, AI and IoT will increase a factory’s output, while significantly reducing costs and end product defects. With coalition from the field level to the logistics level, Smart Manufacturing can unlock the road to enhanced productivity for manufacturers. With manufacturing becoming more efficient, personalized and modular factories will remain in flux.


Data Analytics: Empowering decision making through valuable data insights


Data analytics in Manufacturing aims at improving the product quality of the finished product and its processes. When the analytics is done using the right tools and methods, they help organizations in significantly reducing downtime, enhancing productivity, optimal capacity planning, precise predictive ability, and higher adaptability. The process reaches its goal when the value is generated from big data analytics. This offers manufacturers the opportunity to harness the hidden value from enterprise information systems to streamline production and supply chain management. When data analytics in a smart factory is applied to day-to-day operations, the end result is Operational analytics. This process enables decision-makers in manufacturing firms to be responsive through real-time access to data on-the-go. Operational Analytics uses the data generated from the production machine helping the organization to identify any potential need for maintenance or repair.
These advanced technologies can bring about improvements to the modern manufacturing environments that are confronted by complexity, capacity and speed. By utilising smart manufacturing technologies to the regular production process, organizations will be in a better position to cope up with the changing market demands. With data at the core of operations, manufacturers will be able to better assess risks as well as forecast the impact on product quality and the organization’s bottom-line. 


Build a future-ready foundation to your digital transformation journey through Sonata


Sonata’s platform-based Data approach enables manufacturers to yield faster ROI, lesser time-to-market for data-centric transformations aligned to their business priorities.  Sonata empowers enterprises to realize modern platforms with Reporting and Analytics, Real-Time data insights and consulting powered by IoT, AI/ML solutions. Visit our Data and Analytics offerings page to know more on how we can enable you on your path to true digital transformation. 
 

Powering the Manufacturing Industry through Data and Analytics
Written By: Marketing Team

Blog

Powering the Manufacturing Industry through Data and Analytics

August 17, 2020 7-Minute read

Digital technologies are shaping the manufacturing sector in distinct ways. With the amount of data generated in the industry being enormous, optimum utilization of valuable data still remains to be an untapped opportunity for manufacturing companies.


Data Analytics is all about discovering significant information to streamline business operations and connected processes. The manufacturing industry presently is undergoing a metamorphosis through the growing reliance on advanced digital technologies and Platform-oriented approaches as opposed to the traditional manufacturing landscape. Effective use of structured data results in long-term as well as short-term strategic and tactical benefits.


The transition into such focused operating models is changing how products and services are being consumed. They also provide manufacturers and distributors the ability to stay at their peak in the highly competitive ecosystem. The growing reliance on data-driven models has reimagined the way Manufacturing businesses operate.  

Data and Analytics: Driving the Manufacturing ecosystem


The technology adoption by manufacturers is changing the game for the entire industry, forcing their traditional manufacturing counterparts to evolve to stay productive and efficient in the market. The significance of data and analytics enable the execution of smart operations and management efficiency in the factory, the supply chain, and procurement. Let us take a look at how Data and Analytics are stimulating decision-making in the manufacturing lifecycle.


Industry 4.0: Shifting gears for Manufacturing


Industry 4.0 is the intelligent application of automation in manufacturing processes through various advanced digital technologies like the Internet of Things (IoT), cloud computing thereby creating a smart factory. These digital breakthroughs are aimed at enabling informed decision-making, real-time control of processes and production, and to help in optimum value creation. 
Growing customer expectations and the emergence of connected platforms demand the need for digitalization in manufacturing. The industry remains to evolve in response to the goal of ensuring the right product is made available to the right customer at the right time. IoT still holds vital importance in driving Industry 4.0 as it integrates the entire chain of unstructured data into a connected environment to leverage actionable data and information through efficient collaboration. 
Data and Analytics in Industry 4.0 plays a major role for Smart Factories, were using the data generated from the production machine, helps to ascertain the organization of any potential need for maintenance and repair. 


Connected and optimized Manufacturing through Smart Factories


Smart Factory is a flexible system that aims at holistic integration of all factory operations with the resulting supply chain and procurement activities. This system is constantly evolving in line with the dynamic complexities within the supply chain and procurement operations helping organizations be more responsive and proactive. Smart Factories help the organization focus on meeting compliance standards while ensuring a lesser chance for human errors. 
One of the core advancements powering the manufacturing technology landscape is Industrial AI and Machine Learning. Manufacturers should start harnessing the true value from advanced technologies like AI to enhance production quality, efficiency and thereby significantly impacting the bottom line.


Supply chain complexities  resolved through the power of Data and Analytics


The manufacturing sector has a direct implication from the advent of Big Data trends owing to the pattern and amount of data involved. The amount of data accumulated is growing each day, hence making decisions based on the vast data available is becoming a challenge. Not all data gathered can provide useful information, most of the companies are starting to leverage the vast capabilities it possesses. Organizations should be capable of making Data-driven decisions from improving product quality to tracking the daily production line.
Warehousing and transportation of finished goods are both areas where Big Data tools can be harnessed to yield sizable returns, but very few companies utilize the capabilities to the fullest. The Transportation market is also being transformed with the help of Big Data Analytics and Data-driven methodologies. Big Data technologies facilitate organizations to track consignments, weather conditions, and travel routes on a real-time basis. 


Sonata’s unique Data and Analytics offering


Sonata helps clients transform the traditional data warehousing and business intelligence models to a data-centric platform and modern BI solutions. With our unique Platformation™ approach, data platforms are crafted to enable enterprise digital transformation by anchoring data as the primary asset. We help enterprises with data strategy and realize value by implementing data analytics & visualization solutions. With Sonata’s vast breadth of experience, Enterprises can leverage the experience and frameworks to transform their data & analytics strategies and maximize value from data. Visit our offerings page to know more on transforming data strategies and to accelerate the implementation of your data & analytics programs with Sonata.

retail analytics
Written By: Sushant Kumar

Blog

Why Should Need Retail Analytics ?

September 26, 2019 7-Minute read

The festive season is approaching and the retail sector is abuzz with possible promos to boost the impending sales spike. What is different this year is that smart retailers have already used the advances in mobile and Big Data analytics to figure out what customers are looking for, and stocked up on the same. Is your business also prepared?

As a retailer, you already know the impact that online ordering has had on store footfall. But, did you know that retailers across the globe are fighting back with the same technology? — using advances in Mobile, IoT, BigData, and Analytics, and leveraging the power of Social to figure out who their customers are; what they want; when, where and how they buy it; and stocking and selling the products accordingly. Data powered retail offerings that are pulling in customers now range from ‘will match online price’ offers to valet shopping for groceries. Increasingly, brick and mortar retailers are seeing the power that social media has, and want to leverage it to reach customers – both to increase and strengthen the customer connect and because in today’s world, everyone reaches online first – it has become the simple and go-to option, and something retailers needs to keep in mind as they plan.

Retail analytics makes this all possible. It analyzes customers’ demographics, buying patterns, responses to promotions, and loyalties to:


  • Reduce inventory stock outs and pile ups:
    by identifying better performing brands, products and categories and helping to manage inventory accordingly
  • Help in assortment optimization and product placement:
    on shelves, so that the optimal mix of desirable and moving products are available
  • Enable targeted promotions:
    whereby you’ve personalized offers to particular customers based on their buying patterns and recorded interests
  • Increase conversion ratios:
    by offering targeted content to potential consumers
  • Evaluate marketing campaign effectiveness :
    you tried schemes and campaigns to lure customers and retain existing ones. But have the worked? Are they working? Retail analytics will provide you the data and the answers to such questions, helping you create more effective campaigns in the future. And, if you find this representation of retail analytics capabilities to be suspiciously generalized, here are a few specifics that retail analytics delivers for your business.
  • A view of your entire operations:
    Know how stores across the city, including in different neighborhoods, are performing. By getting data on sales, you can allocate resources so that stores lagging behind can become better performers. Compare online versus physical sales as well. Data such as this is available, but retailers often don’t know how to make sense of it – this is where an analytics solution comes in – it can translate the data into actionable insights.
  • Sales and Demand Forecasting:
    What are the trends that are emerging across product ranges? Are they different from years past? Do they match the forecasts made? Retail analytics has forecasting techniques that factor in individual or group customer behavior, making it more accurate as a forecaster than just reliance on past performance analysis can offer.
  • Loyalty and Promotions:
    When you create a loyalty program that is backed by data and inferences, rather than just taking a shot in the dark, you are much more likely to attract customers. Once you have your customers segmented into various buckets, you can create promos and deals just for that group. Data analytics also means you can measure the efficacy of your loyalty schemes. A retail analytics solution will offer you data on: enrollment growth rate, activity trend of loyal customers, purchase details (points earned/redeemed/expired), total purchases versus purchases by registered customers.
  • Store reports:
    Wouldn’t it be helpful to get data on shopping trends across different customer segments like preferred day and time of purchase, category, and brand preference? Analytics also offers data on month-wise average sales by footfall/staff/store area, and a specific product affinity report by store . You would be able to stock and plan based on a particular store’s footfalls and consumer buying patterns, even send extra staff to a particular store at a given time, when data has told you there is peak traffic.
  • Marketing analysis:
    You get Recency, Frequency, and Monetary (RFM) reports; store/product-wise analysis of effectiveness of promos, re-arrangements; marketing campaign effectiveness, and more. Overall, you will have a strong understanding of and insight into the way your various schemes and campaigns are performing. This helps with gauging efficacy of said programs, and also helps with forecasting and future planning.

    The advantage of retail analytics however, goes beyond providing valuable information to improve the physical store(s). It helps retailers provide a seamless retail experience across multiple online channels by helping them understand the customers they cater to to/want to cater to. The knowledge of customer preferences, lifestyle information, and product knowledge generated by retail analytics, helps retailers effectively leverage social media as a platform to promote new products and offers.

    It is time to approach all retail business issues hitherto managed only by manual tracking or intuition based decisions, with the insightful inputs of hard facts-based retail analytics. What are you waiting for? Get your enterprise analyzed and refine your retail outlet to be festival-ready.
analytics implementation
Written By: Sushant Kumar

Blog

5 Steps To Consider For Analytics Implementation

September 26, 2019 7-Minute read

Big Data. It is here. With oodles of information on the customer. It is up to smart, forward thinking Chief Information Officers (CIOs) to step up and see how the enormous amounts of data generated by the industry, the consumer, and even society, can be used to find information that will help their organizations achieve their business goals — how to use analytics to generate insightful inputs?

Analytics has progressed technologically, keeping pace with the exponential growth of data. There are now a wide array of analytical tools that can be used on both structured and unstructured data. Choosing the right analytical tools and using them right requires information. Information that ranges from the basic need for the analysis to the kind of data we are looking for, the probable sources of that data, methods of data collection, storing, sorting, sifting… even modeling and review of action taken on the basis of the analysis.

Effective implementation of analytics therefore, requires the adherance to a process. Here’s how we suggest going about it:

The future of business depends upon the ability to access and use the 360 degree views of customers that are now available. It is up to the CIOs to empower the management by taking the lead in analyzing all that information.

  • Setting down the goals for analytics:
    This is the traditional way of beginning an analysis, with a fixed goal on scope. You define the gaps to target that the data will help to fill and proceed accordingly. This works well for most assignments. However, with the advent of Big Data, there have been many instances where the sheer volume and variety of the data has thrown up patterns/trends that have gone on to impact strategy and thinking outside the traditional analytic mode.
  • Collection of data:
    Data aquisition from multiple platforms and multiple applications comes next. Is the data internal, external or a mix of both? Structured or unstructured? This is where Big Data comes into the picture with its distinguishing features of sheer volume, variety, and velocity.
  • Data Storage:
    Yes, we have a multitude of sources for data, continuously pouring in information that is invaluable as customer insights… how do we store it? This depends on various factors including cost; the type of data — structured data like sales figures etc., can be stored in Relational Database Management Systems (RDBMS) and data modeled by means other than the tabular relations used in relational databases can be stored and retrieved from NoSQL databases. Another factor is storage capacity —there are quite a few options on the market now, like Cloudera and Hortonworks (from Hadoop) or NoSQL databases like 10Gen.
  • Contextualization:
    Next is the transformation of data into analyzable chunks - placing the data in context and connecting it with other related data to draw learnings. This is pivotal. Analyzing big data and creating valuable insights from it relies heavily on what context the data is seen in. With context comes enhanced individuality of the consumer and his or her behavior. Pig and Hive are platforms used for querying and analyzing large data sets, of both structured and unstructred data.
  • Predictive Analysis:
    What follows is the inference. The prediction and recommendation of solutions based on presented results. This is the ultimate role of analysis — to extract information from data and make predictions for trends and behavior. This also offers a future rather than historical perspective of the customer. By arriving at data backed conclusions and coming to decisions based on them, management is empowered with realtime tools and actionable insights. Text analysis, statistical data analysis, predictive data modeling and graph engines are some of the techniques used here. SAS, R, Gremlin, Cascading are some of the tools and languages which enables us to build such models or applications.
oracle business intelligence
Written By: Ifath

Blog

Oracle Business Intelligence Publisher: Conquering The Reporting Landscape-Made Easier, Better And Faster

September 26, 2019 7-Minute read

Very often companies have different issues in reporting. BI Publisher is a product within the Oracle BI Foundation that enables the creation of highly formatted reports and documents. BI Publisher is not just a tool but a complete reporting solution. This post helps one to make reporting simpler, easier and faster than what most conventional reporting tools have to offer.

BI Publisher is a product within the Oracle BI Foundation and enables creation of highly formatted reports and documents.

Often companies have different issues in reporting. They have different ways of generating invoices, labels, government forms, high fidelity reports and many more. The most common issue faced is that data sources from different databases and applications and output is required in different formats with different delivery destinations as targets.

BI Publisher is a product within the Oracle BI Foundation and enables creation of highly formatted reports and documents. BI Publisher is not just a tool but a complete reporting solution. It makes reporting simpler, easier and faster than what most conventional reporting tools have to offer.

The key feature that sets it apart from other reporting tools is that it makes reporting simplified and better managed by separation of data, layout and translation. While development, generation and maintenance of reports using traditional reporting tools is cumbersome, time consuming, rigid and harder to adopt, BI Publisher is a single solution for developing, generation and even delivering reports. With simplified development and maintenance, it is faster and easier to implement, and at reduced costs.

BI Publisher can be used as a standalone platform for various reporting and publishing needs. It can be used to publish everything that an organization requires to operate, such as: Invoices, Customer Statements, Purchase Orders, Item and Shipping Labels, Bank EFTs and Checks, Financial Statements, Government Forms, Salary Reports and also Interactive Reports (using BI Publisher Enterprise). It is capable of producing a wide range of Report Styles and Output Formats. It supports multiple layouts per report so you can format and display data in whatever ways suitable. Output can be rendered in various formats like HTML, PDF, MS Office formats (Word, Excel, and Power Point) and text formats among others.

Formats can also be used to leverage BI Publisher’s powerful Bursting Engine. The Bursting Engine can take a large report output, split it into smaller sections and deliver each of these sections to the required one or more delivery destinations according to preferences. The various delivery destinations could be Printer, Fax, Email, Web, e-Commerce and FTP to a different Repository or File System among others.

Key Innovations that set it apart from other tools in market:

Most Reports can be built in MS Word leveraging the BI Publisher Template Builder as an Add-In, in RTF format and generate outputs in a wide range of Output Formats like HTML, PDF, RTF, Text etc. Excel and Adobe are the other tools that can be used to build templates. These are the tools that you are used to using and what more? You can now design your own template using these familiar tools.

Most Government forms can be downloaded, marked up and directly used by just adding data fields. You can now have a new report populated with data within a small time. The beauty of this is that you don’t have to recreate the entire formatting in your report as you would with a traditional reporting tool. It is provided in the forms readily available for download from government websites.

Layout features like the complete range of charting capabilities, conditional formatting, interactive reports, use of formulae and functions, multiple layouts, watermark and drilldown support make it highly efficient and scalable.

What you can do:

  • Design your own dashboards
  • Make it work your way with Interactive Reporting
  • Create Enterprise Class, Boardroom-ready reports in a matter of minutes!
  • With a robust Scheduler, it can be used to schedule the report output to be generated and delivered using Bursting as per preferences. This has been made more flexible with more recurrence patterns, custom calendars and scalability.
  • Implement advanced security by using features such as, Role Based Authorization, PDF password protection, control on printing or copying of contents, Digital Signatures etc.
  • Generate and print Pixel-Perfect reports

Advantages:

With simplified development and maintenance, it is faster and easier to implement. This way you can eliminate other expensive solutions and also reduce the administrative cost that comes with them.

You can view reports in various formats directly in the browser with no proprietary plug-ins required.

Data from multiple systems can be combined into a single data model that can be used by multiple reports.

With Interactive reports, you can have Excel like features - filtering and sorting data while viewing the report. It also gives mouse over feature for graphical representation of data in interactive formats.

Superior Scheduling and Bursting capabilities.

Enhanced User Experience.

Being as efficient and scalable as it is, it enables generation of thousands of documents per hour, using low levels of CPU and memory on data sources, resulting in minimal impact to the actual transactional systems.

BI Publisher is built on open standards, which makes it easy to integrate.

With support for over 150 languages, there is no dependency on installed languages and database character sets.

Eliminates the need for expensive language specific printers with font sub-setting and embedding.

With reduced complexity, it is simpler to maintain

Support for multiple languages and territories along with translated User Interface make it the perfect candidate for a Single Global Instance model

Reporting tool for Oracle EBS:

BI Publisher is a tool of abundance for report delivery in most of Oracle’s application suites. BI Publisher was first released as ‘XML Publisher’ with Oracle E-Business Suite 11.5.10. Now, with Oracle’s key move to BI Publisher in R12, it has replaced most standard reports with data extracts and templates. Coming with benefits of putting reporting in the hands of the business user, it is empowering, minimizing dependency on IT staff for all reporting needs and enhancements. End users can easily design report layouts using familiar desktop tools, dramatically reducing the cost, time and resources needed to develop, extend, customize and maintain reports.

Oracle Reports versus BI Publisher:

Oracle Reports is a batch/ scheduled reporting solution offered as a part of Oracle’s Classic Development Tools. The execution environment and programming language for Oracle Reports is Oracle PL/SQL.

The world is now moving away from static reports, towards BI analysis and dashboards. Even though Oracle Reports is a stable tool and has a very large installed base and many reports are built for Oracle EBS already using Oracle Reports, newer tools are here to evolve the way the new world will create and use reports more smartly. With continuously evolving needs of the reporting world, existing tools will have a growing list of short falling features it needs to address. Adaptability to this requires continuous innovations with the evolving insights. Following are some challenges Oracle Reports faced and there rose a need for a reporting solution like BI Publisher to catch light.

  • Powerful but complicated and difficult to use
  • Requires a significant learning curve for even a technical developer to get proficient
  • Proprietary tool and not based on Open StandardsProprietary tool and not based on Open Standards
  • Translations are tedious and laborious
  • Difficulty in exporting data and use of multiple formats for same report

The Future:

Being the one-fits-all reporting solution that it is, keeping with the changing needs with the reporting world, BI Publisher is Oracle’s strategic reporting solution now. Oracle remains committed to the support of its traditional tools and the support cycle is aligned to Oracle’s Fusion Middleware tools. In its Statement of Direction for various tools, Oracle recommends customers to adopt its strategies to protect investment in traditional technologies and encourages allowing new tools and technologies to be adopted.

With this strategy, Oracle allows customers to continue to leverage their existing investments for many years while offering a path to incrementally move to new technologies, at their own pace to start using the productive and familiar development environment of BI Publisher.

Author Bio:

Ifath, a diligent Technical Lead at Sonata Software, works for its Oracle ERP group. She has been a passionate programmer for Oracle EBS Technologies and a Consultant who has worked for top companies like Oracle Corporation. Being a creative solution designer, she handles challenging professional tasks with her expertise that comes from more than 11 years of consulting experience working with Oracle EBS for a wide variety of customers from various verticals. A self-driven individual, she spends most of her time bettering herself by improving her skills and learning new technologies. She holds a bachelor’s degree in Electronics and Communication Engineering.

analytics cpg
Written By: Dhivya Lakshmi U

Blog

Top 3 Analytics Use Cases Sought After By CPG Retailers

September 26, 2019 7-Minute read

For the retail industry, it is the best of times, it is the worst of times. On one hand, the pressure from increased competition, customers who are more demanding than ever, and an explosion of new purchase and delivery channels has forced retailers to be on their toes at all times. Even survival, let alone growth, is a challenge in this environment.

But on the positive side, retailers today can benefit from the kinds of customer insights that were unimaginable, even a few years ago. The huge amounts of data that retailers generate can give them the power to delight their customers like never before, thereby driving greater efficiency, higher sales and more profits!

What retailers today need is a strong analytics platform that can provide useful, actionable insights that can help improve each area of operation including the supply chain, pricing, marketing, customer acquisition, selling etc.

With accurate, real-time insights such as - Which product combinations are your customers buying? How frequently are they buying? Who are your most valuable customers? Which promotions will they respond to? – Retailers can get a deeper understanding of customer behaviour and purchase patterns, enabling timely and informed decision making.

Here are some ways in which analytics can help retailers:

Product Affinity:

Analysing shopping behaviour to identify what products are generally bought together can lead to better product placement (whether in-store or online). For example, if your data shows that people are likely to buy bread, eggs and butter together, then it makes sense to stock them together, rather than simply following traditional divisions (Bakery, dairy etc.) While the above example is intuitive, there are several instances where the affinity might not be so obvious. Data can reveal these trends.

Redoing the store layout according to your product affinity analytics can help improve sales

Customer Segmentation:

Traditional customer segmentation has several limitations, especially given today's complex customer landscape. Rather than relying only on factors such as age, location and other demographics, analytics allows you to develop far superior customer segmentation that is based on factors such as buying behaviour, customer journey, social media behaviour and other non-obvious factors that have a profound impact on sales. Understanding customer buying patterns and predicting customer behaviour can help in better promotions, better sourcing and higher sales.

Inventory management:

Inventory control is one of the biggest challenges that retailers face. Maintaining the right amount of stock, whether in warehouses or stores is challenging. Being out of stock affects sales and customer satisfaction, while having too much stock impacts profitability. Closely tracking sales trends, customer preferences and buying patterns can enable better inventory management.

These insights can help drive more effective marketing and sales campaigns, discover new and sustainable ways to improve efficiency across all channels and consequently drive greater profitability and sales.

Want to know how you can implement this for your business? Write in to us at [insert email ID] and we'd love to know more about your business and see how we can help.

Sonata's retail analytics platform, Retina, delivers scalable, flexible, advanced and cost-effective analytics solutions for optimizing merchandizing and marketing decisions.

Click on the brochure to know more

ai b2b companies
Written By: Arindam Panda

Blog

The Power Of AI And Machine Learning To Transform B2B Companies

September 26, 2019 7-Minute read

It is not surprising that Gartner lists AI as well as Intelligent Apps and Analytics among its Top 10 Strategic Technology Trends for 2018. The impact of these technologies has started to become apparent even in our daily lives.

B2B companies are also relying in increasingly on artificial intelligence, machine learning and big data to make their organisations more efficient, customer friendly and innovative. Here are some of the biggest application areas for these technologies in a B2B organisation:

Insights into Customer Behaviour

Machines are more capable than humans when it comes to efficiently consolidating data and analysing it to identify patterns and trends. The power of machine learning allows for much better customer insights as well as ability to respond immediately. Machines can be programmed to analyse input and respond immediately to customers. Such an ability throws up a wide range of applications, right from improving content marketing to enhancing customer service to upsell opportunities.

Predictive Account Management and Marketing

Analytics allows you to distil down the features and attributes of your most desirable (read: most profitable) customers, so that you can make informed decisions about the type of customers you seek to attract through your marketing efforts. Not only will this help to optimize marketing dollars as well as other resources, it will ensure that your revenue per customer goes up too. While humans have been doing similar exercises manually for ages now, the efficiency and scale at which the machine does this is what is truly remarkable.

Generating New Leads

Lead generation is a key aspect of the sales cycle. Traditional/manual methods of scouting for new leads by browsing through sources such as LinkedIn, company websites etc. to find the contact information of prospects can be exhausting, and also highly inefficient. Through machine learning and AI, B2B companies can not only gather reams of lead generation data, but the machine can also analyse a variety of unstructured data, whether emails, social posts, telephonic conversations, chats etc. to identify patterns and short-list more promising leads based on the data. This information can be vital for effective marketing campaigns.

Reduce Human Effort

Despite all the bad press about machines taking away human jobs, the truth is that there are immense benefits to handing over mundane, repetitive jobs to machines. This not only helps the process to be done effectively, but it also frees up human time such that they can focus on more high-end tasks that require creativity, strategic thinking. So, while machines can do the grunt work of processing data and finding useful patterns, humans can use those patterns to find the insights that can help improve decision making.

The number of use cases for machine learning, AI and big data for B2B businesses is limited only imagination. From determining the right target audience to optimising marketing campaigns to assessing customer satisfaction, the above applications have the potential to transform businesses.

Click here to read more about how your business can benefit from the right analytics implementation.

https://www.sonata-software.com/microsites/analytics